Indicators are mathematical calculations based on historical price and volume data, and they are used to analyze and interpret the behavior of financial markets. Technical analysts use indicators to identify trends, momentum, volatility, and potential buy/sell signals in the market.
Here are some general steps to follow when using indicators in technical analysis:
-
Choose the right indicators: There are various indicators available to technical analysts, and it's important to choose the ones that are most relevant to the market you are analyzing. Some popular indicators include moving averages, Relative Strength Index (RSI), Bollinger Bands, and MACD.
-
Analyze the charts: After selecting the relevant indicators, you should look at the price and volume charts for the asset you are analyzing. This can help you identify key trends and support/resistance levels.
-
Apply the indicators: Once you have identified the relevant indicators and analyzed the charts, you can apply the indicators to the charts. This will help you identify patterns and trends that may be difficult to see with the naked eye.
-
Interpret the results: After applying the indicators, you should interpret the results to gain insights into the behavior of the market. This can help you identify potential buy/sell signals and make more informed trading decisions.
There are many popular indicators used in technical analysis, and the choice of which indicator to use depends on the trader's individual preferences and the specific market being analyzed. Here are some commonly used indicators:
-
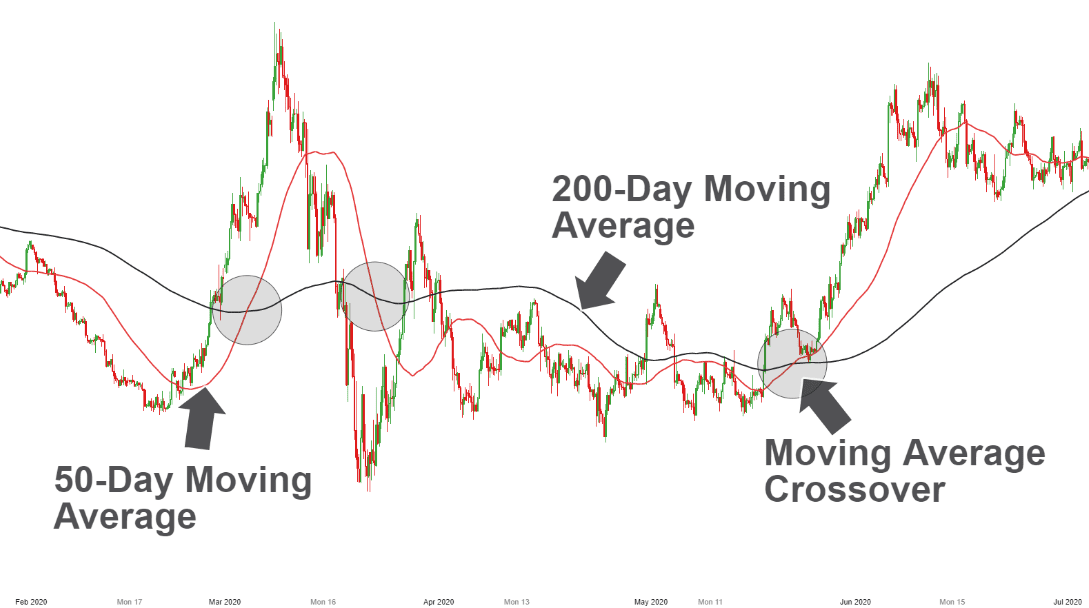
Moving Averages: A moving average is the average price of an asset over a certain period of time. The most commonly used moving averages are the 50-day and 200-day moving averages. Moving averages are used to identify trends and potential support and resistance levels.
-
Relative Strength Index (RSI): RSI is a momentum indicator that measures the magnitude of recent price changes to determine whether an asset is overbought or oversold. It ranges from 0 to 100 and is usually plotted alongside the asset's price chart.
-
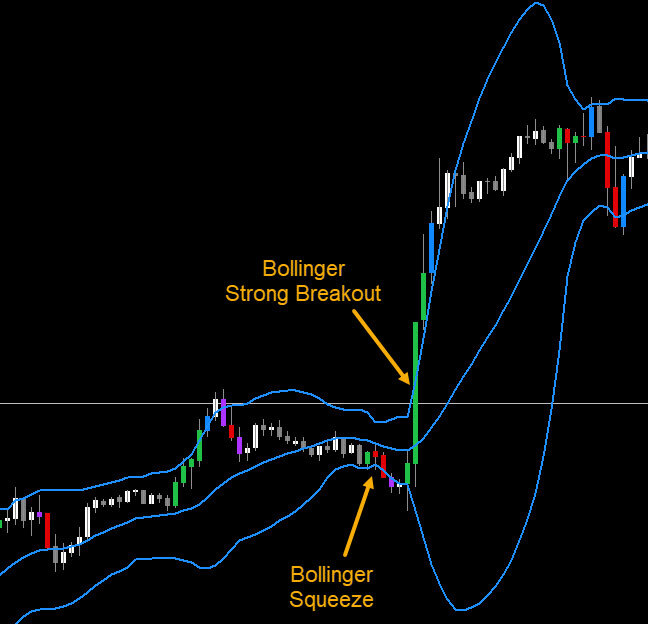
Bollinger Bands: Bollinger Bands are a volatility indicator that consists of a moving average and two standard deviations plotted above and below the moving average. The bands expand and contract based on market volatility, and they are used to identify potential buy and sell signals.
-
Moving Average Convergence Divergence (MACD): MACD is a trend-following momentum indicator that measures the relationship between two moving averages. It is used to identify trend reversals, momentum changes, and potential buy and sell signals.
-
Fibonacci retracement: Fibonacci retracement is a tool used to identify potential support and resistance levels based on the Fibonacci sequence. It is based on the idea that markets will often retrace a predictable portion of a move, after which the trend will continue.
These are just a few of the many indicators used in technical analysis. It's important to note that each indicator has its strengths and weaknesses, and it's important to understand how to use them effectively in order to make informed trading decisions.
Here is an example of a trading strategy built upon moving average crossover strategy, which is a simple and popular trading strategy.
The moving average crossover strategy is based on two moving averages, a shorter-term moving average, and a longer-term moving average. When the shorter-term moving average crosses above the longer-term moving average, it is seen as a bullish signal, and when the shorter-term moving average crosses below the longer-term moving average, it is seen as a bearish signal.
Here is an example of how this strategy could be applied to the daily chart of a stock:
-
Identify the moving averages: Let's say we choose a 50-day moving average as our shorter-term moving average and a 200-day moving average as our longer-term moving average.
-
Wait for the crossover: We wait for the 50-day moving average to cross above the 200-day moving average, which would signal a bullish trend. Once this crossover occurs, we enter a long position.
-
Place a stop-loss: We place a stop-loss below the recent swing low to limit our potential losses if the trade goes against us.
-
Take profits: We take profits when the 50-day moving average crosses below the 200-day moving average, which would signal a bearish trend.
It's important to note that this strategy may not work in all market conditions, and it's important to use proper risk management techniques to minimize losses and maximize profits.
Bollinger Bands breakout strategy is another popular trading strategy. The Bollinger Bands breakout strategy is based on the idea that when the price of an asset breaks out of the Bollinger Bands, which are based on a moving average and standard deviations, it signals a potential trend reversal or a continuation of the current trend.
Here's an example of how this strategy could be applied to the daily chart of a stock:
-
Identify the Bollinger Bands: Let's say we choose a 20-day moving average and two standard deviations as our Bollinger Bands.
-
Wait for a breakout: We wait for the price of the stock to break above the upper Bollinger Band, which would signal a potential bullish trend. Once this breakout occurs, we enter a long position.
-
Place a stop-loss: We place a stop-loss below the recent swing low or the lower Bollinger Band to limit our potential losses if the trade goes against us.
-
Take profits: We take profits when the price of the stock breaks below the lower Bollinger Band, which would signal a potential bearish trend.
Alternatively, if we are looking for a short trade, we could wait for the price of the stock to break below the lower Bollinger Band, which would signal a potential bearish trend. Once this breakout occurs, we enter a short position.
It's important to note that technical analysis is not foolproof and there are many factors that can influence market behavior. Indicators should be used in conjunction with other forms of analysis, such as fundamental analysis and market news, to gain a more comprehensive understanding of the market. Additionally, it's important to use proper risk management techniques to minimize losses and maximize profits.

